Logstash
Contents
[hide]Logstash + Elasticsearch + Kibana
Logstash + Elasticsearch + Kibana is one of powerful solutions for log aggregation / dashboard [1]
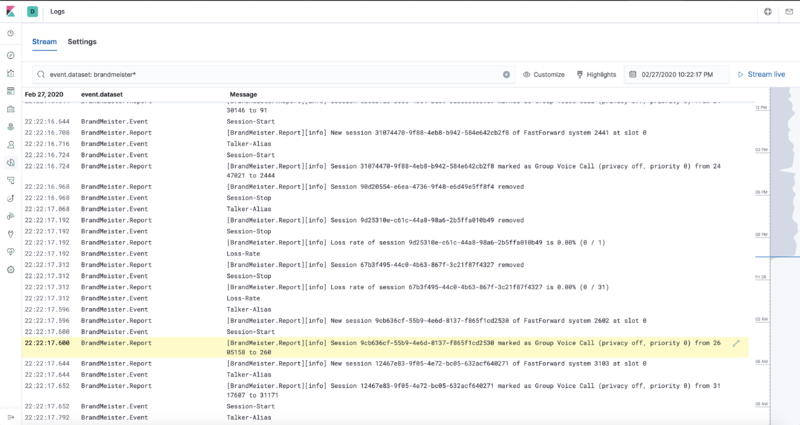
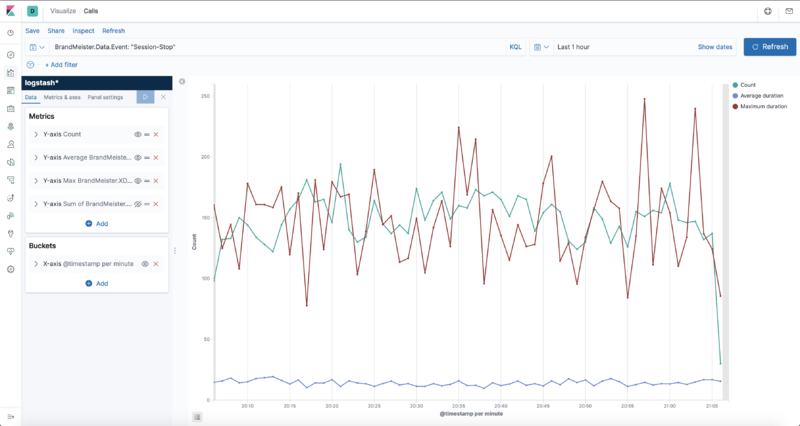
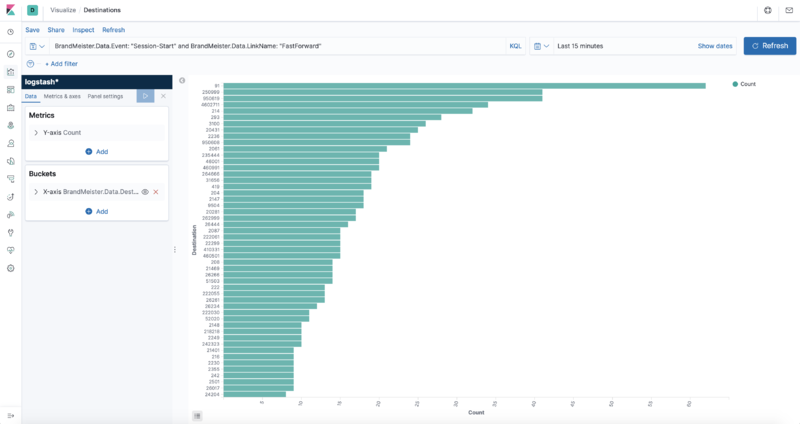
You can use it to aggregate logs from several BrandMeister servers, simplify search or make technical dashboards.
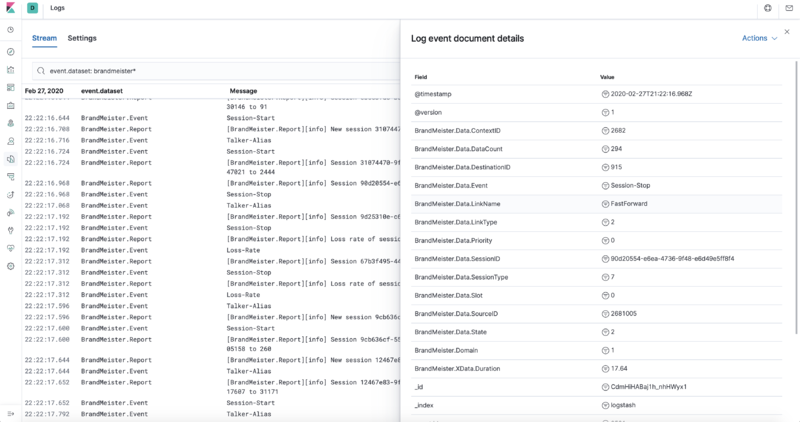
BrandMeister provides direct interface to Logstash to provide log reports as well as internal event's data.
Configuration
It's highly recommended to install ELK stack to the separate machine. Logstash's certificate can be self-signed, BrandMeister accepts any.
BrandMeister.conf
- LumberJack :
- {
- address = "localhost"; // Logstash address
- port = 10514; // Logstash port configured to accept Lumberjack protocol
- options = 3; // Bit field: bit 0 - transmit log reports, bit 1 - transmit system events
- capacity = 1024; // Buffer capacity (line count)
- };
/etc/logstash/conf.d/lumberjack.conf
- input {
- lumberjack {
- id => 'lj'
- host => '127.0.0.1'
- port => 10514
- ssl_certificate => '/etc/logstash/logstash.crt'
- ssl_key => '/etc/logstash/logstash.key'
- type => lumberjack
- }
- }
- filter {
- date {
- match => [ 'timestamp', 'ISO8601' ]
- }
- ruby {
- path => '/opt/BrandMeister/brandmeister-logstash.rb'
- }
- }
- output {
- elasticsearch {
- hosts => [ 'localhost:9200' ]
- }
- }
Operational state
status/system.php : LumberJack
- Active - connection is active
- Overflow - buffer overflow, one or more records lost
 BrandMeister


